
How bad is too bad? - Designing pairwise comparison studies for quality assessment
When we view images or videos, the presence of visual artifacts can significantly degrade our experience. These artifacts might arise due to hardware or software limitations—for instance, compression artifacts in a video or reduced frame rates on a display. Since such imperfections are often unavoidable, understanding how they affect user perception is essential. Quantifying this impact allows us to make informed choices between devices (e.g., a 4K display vs. a 240 Hz display) or algorithms (e.g., JPEG compression levels). Moreover, it aids in identifying the limitations of existing systems and facilitates the development of better technologies.
One effective approach to measure the impact of artifacts on perceived quality is through subjective quality assessment experiments. In these experiments, human participants evaluate a set of distorted images or videos. Two popular methods for conducting such experiments are direct rating and pairwise comparisons. Let’s explore these methods and why pairwise comparisons often come out on top.
The Challenge of Direct Ratings
Direct rating methods, such as mean opinion score (MOS), involve asking participants to assign a score to each condition (e.g., images or videos) on a predefined scale, such as a Likert scale ranging from very poor to pristine quality. While this method seems intuitive and straightforward, it has a significant drawback: the results can vary widely across participants.
Even with thorough training, different people interpret and use the scale differently. For example, one participant might reserve high scores for only the most exceptional images, while another might be more generous. To complicate matters further, the same participant might use the scale inconsistently on different days. This variability makes it challenging to obtain reliable and reproducible results.
Why Pairwise Comparisons Shine
Pairwise comparison methods simplify the task for participants. Instead of assigning scores, participants are shown two images or videos at a time and asked to choose which one has better quality. This task is much easier for non-experts to perform accurately and requires minimal training. Pairwise comparisons also tend to produce less noisy results than direct rating methods. Additionally, they often require shorter experiment durations.
However, pairwise comparisons come with their own challenges. The results of these experiments must be mapped onto a practical scale, which can be a complex process. Let’s break it down.
How Pairwise Comparison Experiments Work
Imagine a typical pairwise comparison experiment for image quality assessment. Participants are presented with a series of image pairs, each containing different levels of distortion. For each pair, they select the image they perceive to be of higher quality—closer to its distortion-free reference image. Each decision is recorded in a comparison matrix, denoted as C.
In this matrix, each entry Cij represents the number of times image i was preferred over image j. From this, the probability of image i being chosen over image j is calculated as:
\( P_{ij} = \frac{C_{ij}}{C_{ij} + C_{ji}} \)
Since human judgments are inherently subjective, the data tends to be noisy. To address this, the experiment employs the Thurstone Case V observer model. The Thurstone model assumes that participants evaluate image quality by assigning a single quality value to each image. These quality values are treated as random variables that follow a normal distribution, with the same inter- and intra-observer variance. Using this model, the probability of the population preferring image A over image B (P(A > B)) can be mapped to a corresponding quality difference (qA – qB) using an inverse cumulative normal distribution. The variance of this distribution is set such that the P(A > B) = 0.75 is equal to qA – qB = 1 [JND]. Just Noticeable Difference (JND) units provides a practical and interpretable scale for measuring quality differences.
Finally, the quality scores for each image are estimated using maximum likelihood estimation (MLE). This method identifies the set of quality scores that maximize the likelihood of observing the experimental data (C). For a deeper dive into pairwise comparison experiments, refer to this article.
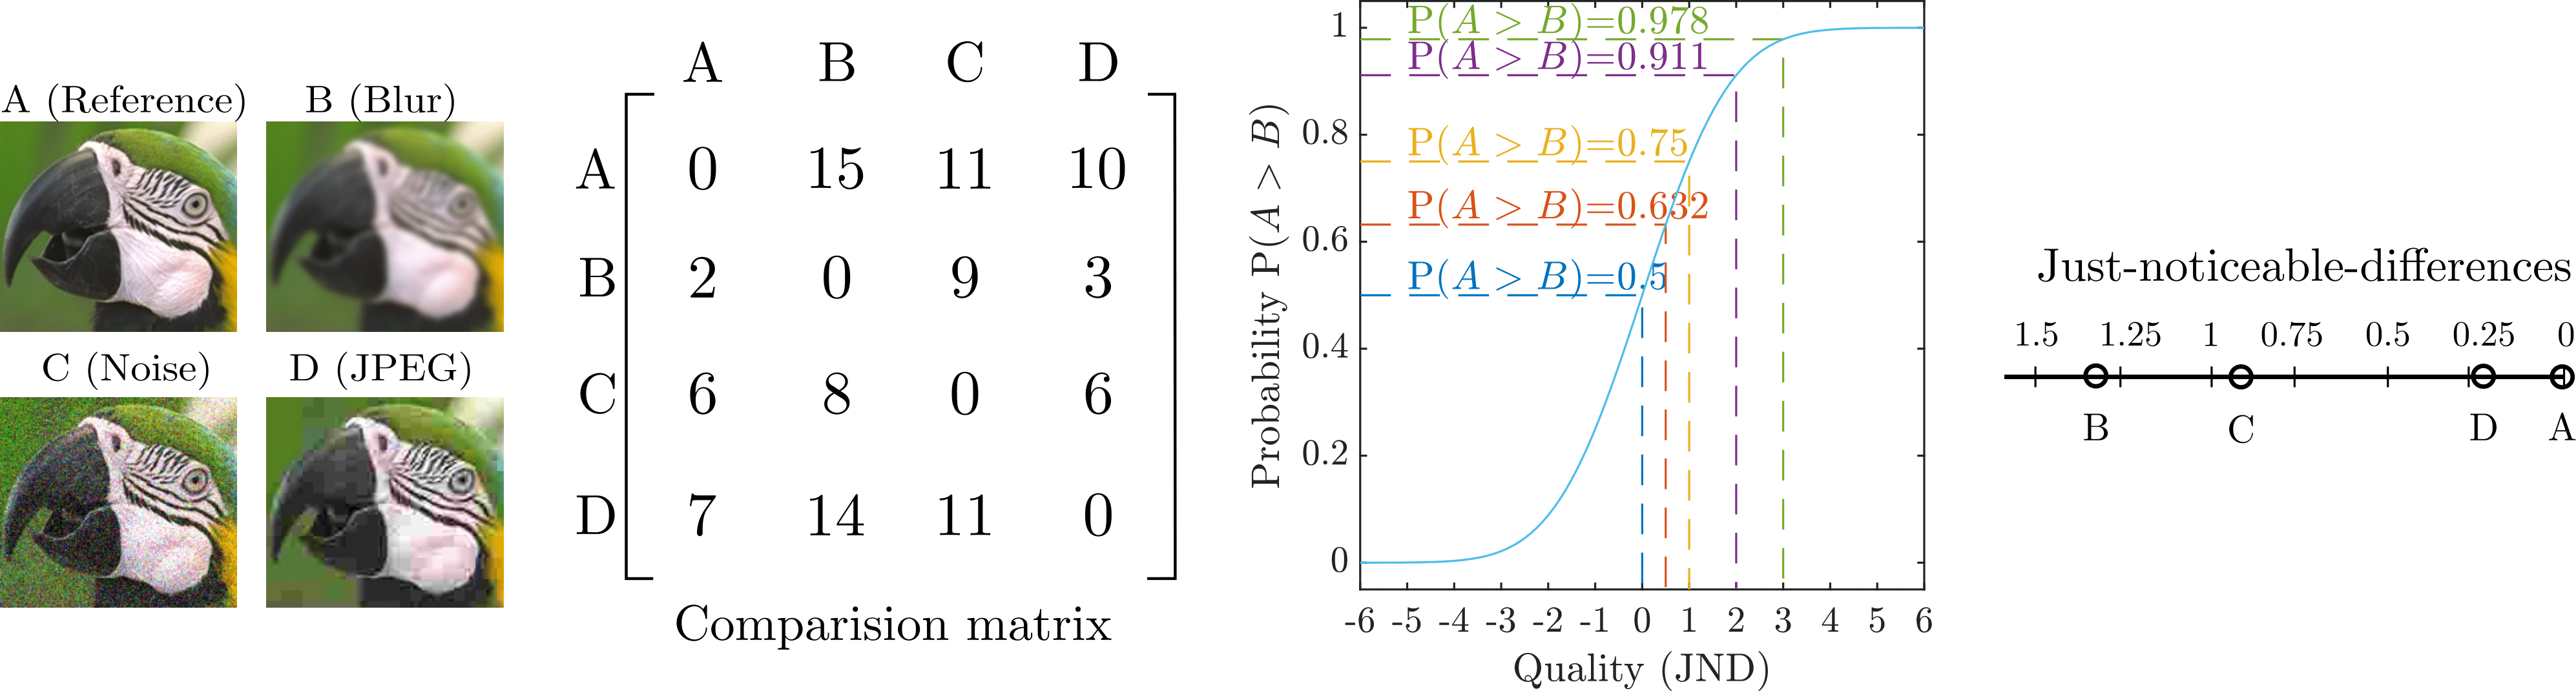
An example of a pairwise comparison protocol is illustrated in the figure below. An image is degraded with 3 different types of distortions. Each image is then compared with every other image by multiple participants and the results are stored in a comparison matrix. The matrix is then mapped to a JND scale using an inverse cumulative normal distribution. The JND scores can be used to rank and compare the three tested distortions (JPEG is better than Noise and Noise is better than Blur).
Objective quality metrics
While subjective studies are an ideal way to determine the quality of a method, they are expensive, time-consuming, and not scalable. In contrast, objective quality metrics are computational models that aim to predict the quality difference between two images or videos without any user input. The results from subjective experiments provide a means to calibrate such objective metrics.